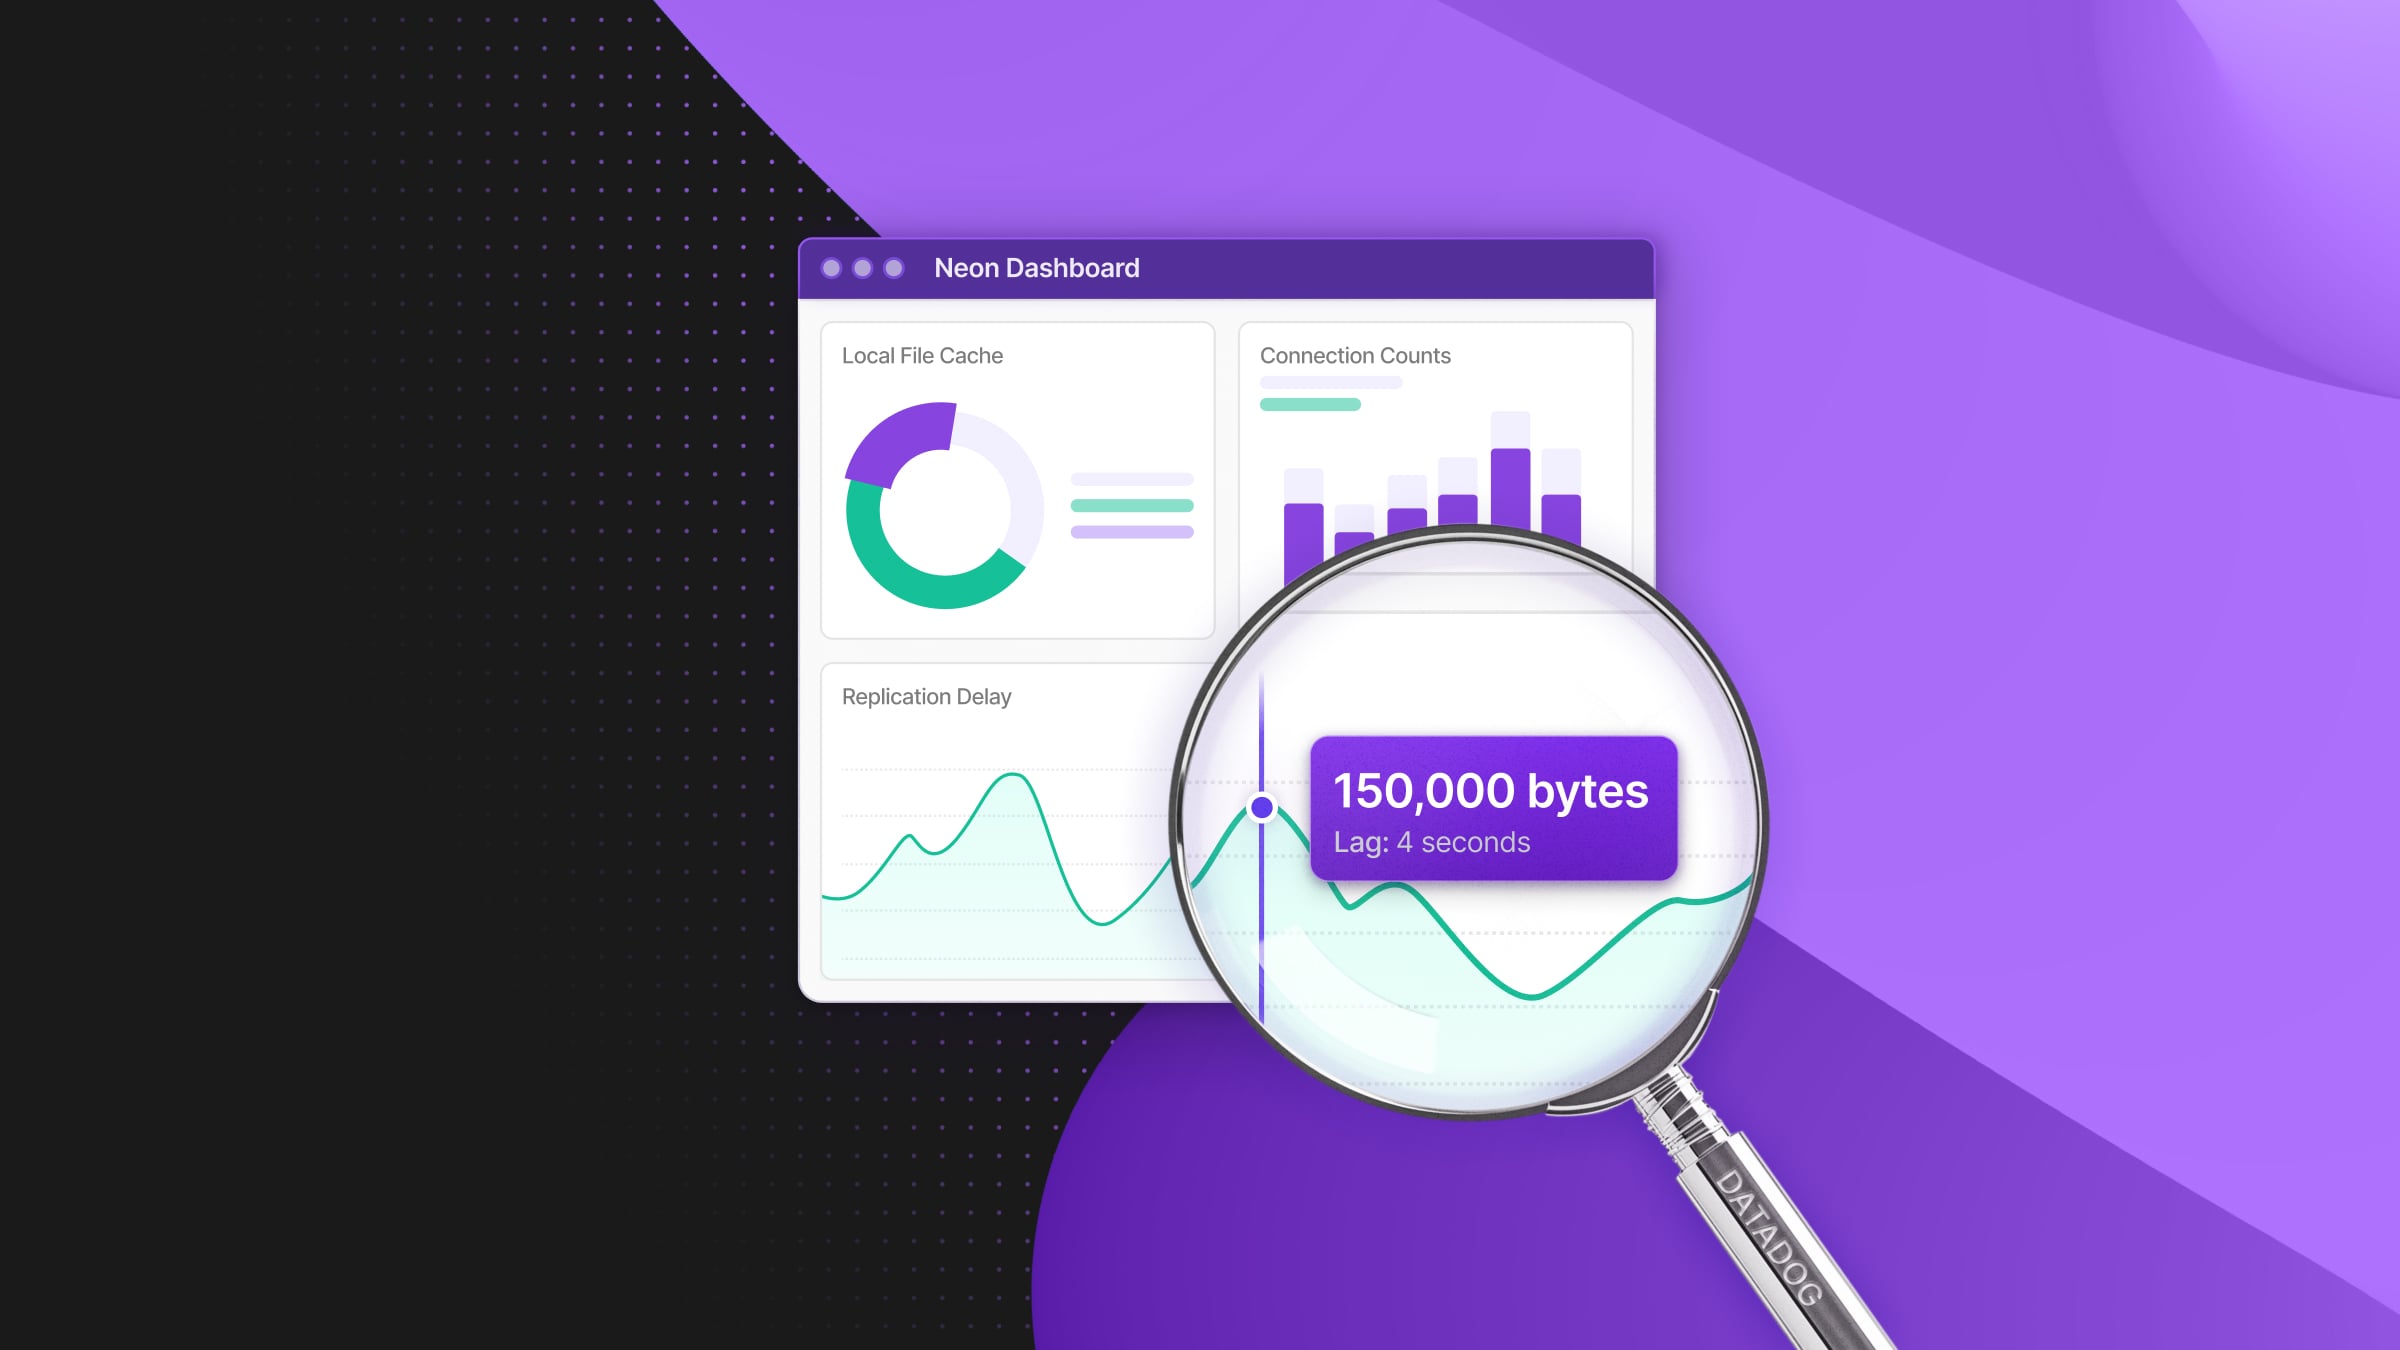
We keep working on improving observability for Neon users. A first big step came with the launch of our monitoring dashboard, and to continue checking boxes, we’re now launching an integration with Datadog so you can track essential metrics from your Neon databases directly in the Datadog platform.
Neon metrics exposed to Datadog
The metrics exposed to Datadog include:
- Connection counts (
neon_connection_counts): Tracks the total number of database connections, categorized by state (active, idle).- Why it’s useful: Helps you identify potential connection bottlenecks and optimize connection pooling strategies.
- Replication delay (
neon_replication_delay_bytes, neon_replication_delay_seconds): Measures replication lag to ensure data consistency across replicas.- Why it’s useful: Helps you detect potential issues in replication processes.
- Compute metrics (
host_cpu_seconds_total,host_memory_usage_bytes): Tracks CPU and memory usage for your compute endpoints.- Why it’s useful: Helps you optimize your autoscaling limits.
- Local File Cache metrics (
neon_lfc_cache_size_limit,neon_lfc_hits,neon_lfc_misses,neon_lfc_used,neon_lfc_writes)- Why it’s useful: Helps you monitor cache size to identify performance bottlenecks in Neon’s storage. (If you’re like 🤨, read the section below.)
- Working set size (
neon_lfc_approximate_working_set_size_windows): Represents the active portion of your data, in pages of 8,192 bytes.- Why it’s useful: Gives you valuable insight on your optimal memory configuration and access patterns.
- Postgres statistics (
neon_pg_stats_userdb): Aggregated metrics from thepg_stat_databasePostgres view, including database size, deadlocks, and row operations (inserts, updates, deletes).- Why it’s useful: You can get insights into Postgres’ internal processes. .
By configuring the integration with your Datadog API key, Neon automatically sends these metrics to your selected Datadog destination, for all computes in your Neon project.
A closer look at some key metrics
Some of the metrics above are self-explanatory, but others might be more obscure to you—especially if you’re just getting started with Neon.
Local File Cache
First, let’s take a closer look at the local file cache (LFC) metrics and its particular significance within the Neon architecture. The LFC in your Neon database serves as an in-memory storage layer, designed to expedite data retrieval by minimizing disk I/O operations. Monitoring the LFC size can help you identify performance bottlenecks originating from this layer.
For example, if your workload frequently accesses a dataset larger than the allocated LFC size, the cache may not effectively store all necessary data, leading to increased cache misses and requests to retrieve data from our storage layer (via pageserver getpage requests)—a.k.a., reduced performance.
The origin (and solution) of this bad performance problem might not be easily diagnosable if you’re only monitoring your CPU/memory usage. Instead, you should also also keep an eye on:
- Cache hit ratio. This metric indicates the percentage of read requests served directly from the LFC. A high cache hit ratio signifies efficient caching, while a low ratio suggests that the cache size may be insufficient for your workload. You can view the cache hit ratio using the neon_stat_file_cache.
- Actionable bit: If you observe a low cache hit ratio, consider increasing your compute size to allocate more memory to the LFC.
- Cache misses. A high number of cache misses indicates that data is frequently being fetched from storage rather than the cache (not ideal). This info is available via the neon_lfc_misses metric.
- Actionable bit: If you observe high cache misses, consider increasing your compute size to allocate more memory to the LFC.
One more thing that can help you optimize Neon’s performance related to LFC: understand your data access patterns. If your workload involves accessing a large working set of data that exceeds the LFC capacity, this may slow things down. The best path is to optimize queries and rethink indexes so cache utilization can be improved.
Postgres’ working set size
Another metric to get familiar with is working set size. The working set size in Postgres reflects the active portion of your data – the data that’s frequently in use within your dataset – and to optimize performance, you’d like it to be in memory.
In Neon, we dynamically estimate the working set size over specific time intervals to be able to autoscale your workload optimally, always keeping your working set size within memory. We explain how we do this in this blog post. (Hint: we use a modified version of HyperLogLog that includes a sliding window continuously measuring the number of unique pages accessed over the last minutes.)
But going back to monitoring, here’s some examples of how keeping an eye on the working set size can give you practical information:
- Comparing the working set size to your LFC capacity gives you hints on if the cache is adequately sized to hold the active data.
- A large working set size equals high memory demand. If this is you, you may want to ensure that your compute capacity is large enough to keep performance high.
- Monitoring changes in the working set size can help you identify inefficient queries that access more data than necessary. For instance, if certain queries cause a sudden spike in the working set size, they may be retrieving more data than they should.
Lastly, trends in the working set size over time can inform future resource requirements. For example, a steady increase may indicate growing data usage patterns, telling you that it’s time to raise your autoscaling limit.
Deadlocks and row operations
Regularly monitoring a few Postgres statistics can also give you a valuable view at the Postgres internals. Among the information accessible through the pg_stat_database view, there’s a couple things you may want to add to your monitoring dashboard:
- Row operations (INSERTS, UPDATEs, DELETEs). Monitoring these operations will help you identify tables with heavy write activity, for example, which might inspire some optimization—e.g. by adding a read replica to make sure performance doesn’t suffer.
- Postgres deadlocks. In Postgres, a deadlock occurs when two or more transactions block each other by holding locks on resources that the other transactions need. This situation leads to a standstill where none of the involved transactions can proceed. Postgres automatically detects and resolves them by aborting one of the conflicting transactions, but it’s not good to see frequent deadlocks. If this is your case, there might be underlying issues related to your transactions or application logic.
Get started: import the Neon dashboard into Datadog
To make it super easy for you to get started, we’ve put together a JSON config file that you can import into Datadog to get a few Neon metrics into a dashboard right away.
Follow the instructions in our docs to import the dashboard and to get all the details about the Datadog integration. If you have any questions, reach out to us (we’re on Discord).


